A five-second overview
We decompose mathematical measures of difference between texts to identify the words that contribute most to that difference.
In a nutshell
Stylometric distances such as Burrows’s Delta help attribute texts and group them by author by comparing their vector representations. But which words in those vectors contribute most to the difference between individual texts or groups of texts?
Burrows’s Delta expresses the difference between two texts as a distance between their standardized frequency vectors:
Throughout this explanation, we omit division by the number of selected words, n. For a fixed word set, this changes the scale but not the ordering of distances.
Each coordinate z is a word frequency expressed on a common scale: subtract the corpus mean μ from the relative frequency p, then divide by that word’s standard deviation σ:
Before the final sum, the distance is calculated separately for each word. The mean cancels in the subtraction, so the contribution of word i can be written as:
We can therefore quantify each word’s contribution, compare it with the others, and identify the strongest lexical signals by which the method distinguishes writing styles.
A worked example with three words
Consider two hypothetical texts. These numbers illustrate the formula; they are not results from a comparison of writers.
| Word | z in T₁ | z in T₂ | Contribution δ |
|---|---|---|---|
| давеча | 2 | 0 | 2 |
| шёпотом | 0 | 1 | 1 |
| и | 0.5 | 0.5 | 0 |
Delta is 2 + 1 + 0 = 3. Here, «давеча» (earlier today) accounts for two thirds of the distance, «шёпотом» (in a whisper) for one third, and «и» (and) contributes nothing because its frequencies are identical.
For the formulas and decomposition, see Section 2 and Section 4 of the paper.
The approach
Represent the texts
Build comparable frequency profiles using the same preprocessing and feature vocabulary.
Compare the profiles
We start with established distances: Burrows’s Delta, Euclidean Delta, and Cosine Delta. We then test Jensen–Shannon divergence on probability distributions derived from uncentred standardized frequencies, and rank-turbulence divergence, developed by P. S. Dodds and colleagues, on the corresponding word rankings. These extensions yield Jensen–Shannon Delta and Rank-Turbulence Delta.
Inspect the contributions
Decompose the comparison into token-level contributions, then examine how the interpretation changes with the feature set and perturbations of the data.
Reading the figure
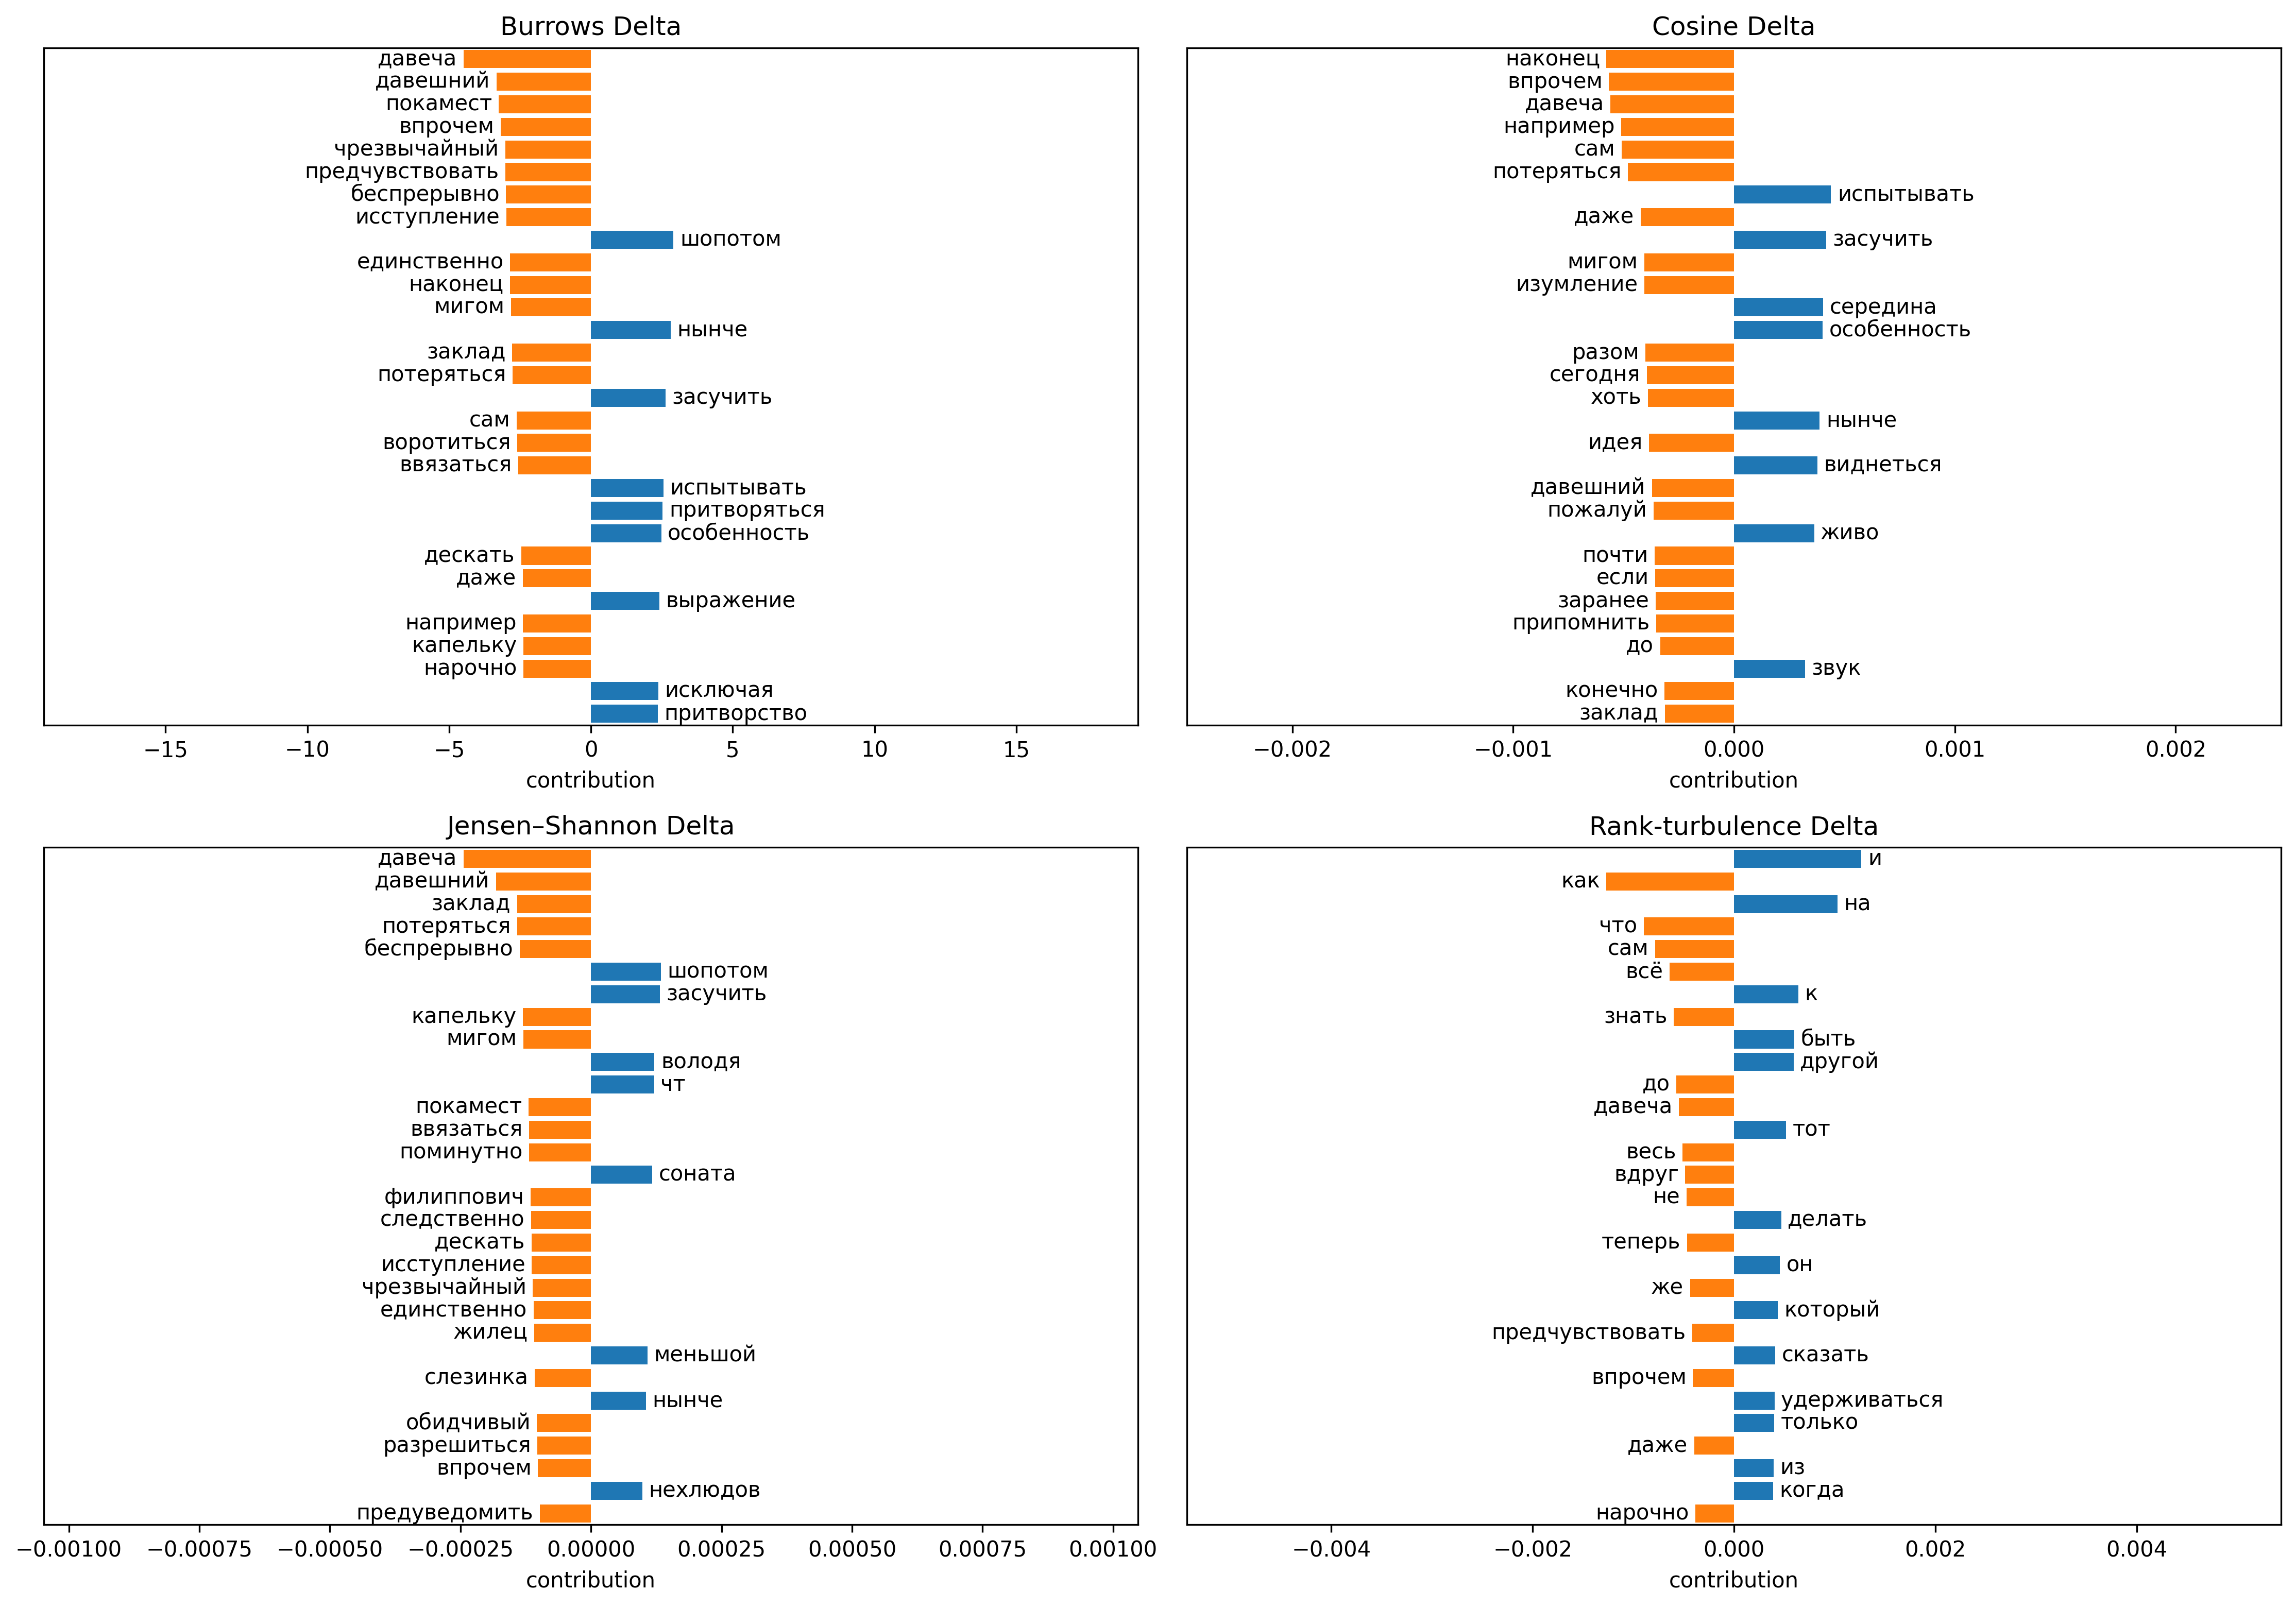
The figure compares the styles of Fyodor Dostoevsky and Leo Tolstoy. For each author, we average the standardized frequency vectors of his texts, then decompose the distance between the two author profiles into word-level contributions.
Open full-size figure · Figure source

Orange bars on the left: Dostoevsky. Blue bars on the right: Tolstoy. Bar length shows the size of a word’s contribution; its direction identifies the author whose profile gives that word greater weight. A bar pointing left does not mean a negative distance.
For example, Burrows’s Delta highlights «давеча» (earlier today) and «давешний» (from earlier today) on Dostoevsky’s side, and «шопотом» (in a whisper, as spelled in the corpus) and «нынче» (today / nowadays) on Tolstoy’s side. Each panel applies a different measure to the same author pair, so the most prominent words change. Read the panels against their own scales.
Try it on your texts
The repository contains notebooks, dependencies, and reproduction instructions. Begin with a supplied analysis, inspect the frequency profiles and contribution plots, then adapt the pipeline to a corpus whose composition you understand.
Code & notebooks ↗Citation
Rank-Turbulence Delta and interpretable approaches to stylometric Delta measures. Digital Scholarship in the Humanities, 41(3), 1616–1630.
BibTeX
@article{pronin2026rank,
  author = {Pronin, Dmitry and Kazartsev, Evgeny},
  title = {Rank-Turbulence Delta and interpretable approaches to stylometric Delta measures},
  journal = {Digital Scholarship in the Humanities},
  year = {2026},
  volume = {41},
  number = {3},
  pages = {1616--1630},
  doi = {10.1093/llc/fqag072}
}